 Get RS9 APK
The full fieldnote.
Open a chapter for the working, examples and exceptions.
Start with the bowling ledger
Bowling economy is the number of runs charged to a bowler per over. In six-ball cricket, calculate it as conceded runs × 6 ÷ valid balls bowled. Dot-ball percentage describes how often a chosen definition of a dot occurred. One measures cost; the other describes the distribution of scoring events.
For this guide, a dot is a valid delivery on which the batting team scores no runs, and the denominator is valid balls. Data providers can use different conventions, so state yours before comparing tables. All players, overs and totals below are invented demonstrations, not real-match evidence.
Convert a partial over before dividing
An imaginary bowler finishes with 3.4–0–22–1. Read that as three overs and four balls, no maidens, twenty-two conceded and one wicket. The twenty-two valid balls equal 22/6 overs. Economy is therefore 22 × 6 ÷ 22 = 6.00.
| Spell | Valid balls | Conceded runs | Economy |
|---|---|---|---|
| A: 3.4 overs | 22 | 22 | 6.00 |
| B: 4.0 overs | 24 | 28 | 7.00 |
| C: 2.3 overs | 15 | 20 | 8.00 |
Dividing twenty-two by the decimal 3.4 would produce about 6.47. That plausible-looking answer is wrong because the denominator is not decimal overs.
Do not charge every team run to the bowler
Imagine a spell in which batters score eighteen runs, wides add two, a no-ball adds one, byes add three and leg-byes add two. The team gained twenty-six. The bowler conceded twenty-one: eighteen plus two plus one. MCC Law 18 assigns batter runs, wides and no-ball extras to the bowler's account; the byes and leg-byes remain elsewhere.
If that spell lasts three overs, economy is 7.00, not 8.67. A delivery producing a bye is not a zero-team-run dot under our definition, even though it does not increase the bowler's conceded-run figure. This is why the metric definition matters.
Two six-run overs with different shapes
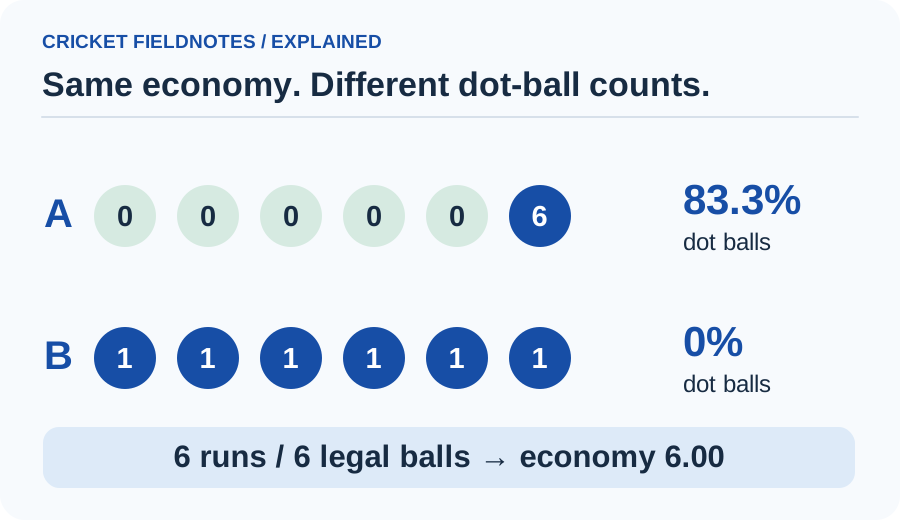
Compare these two invented sequences, each containing six valid deliveries, with every run scored from the bat. Over A is 0, 0, 0, 0, 0, 6. Over B is 1, 1, 1, 1, 1, 1. Both cost six runs and both have economy 6.00 for that over. Their dot percentages are very different: 83.33% and 0%.
It would be misleading to call A automatically better because it contains five dots. The last delivery erased the run-cost difference. Equally, economy alone hides the distinct sequences. To discuss pressure, add the match situation and actual delivery descriptions; the percentages cannot reveal whether the six was a poor ball or an exceptional shot.
Keep wicket-taking beside control
Economy does not include wickets in its formula. An attacking spell can concede more while removing important batters; a quiet spell can take no wickets. Read the figures together before deciding what the bowler contributed. Avoid building a single homemade rating unless you can explain why its weights suit the question.
A wicket delivery with no team runs can count as a dot under the definition used here. It should still retain its wicket marker in the sequence. Reducing it to an ordinary zero would discard the most consequential event in that over and make a pressure chart less informative.
Check role, sample and recording quality
Comparing an early spell with a late-innings spell can confuse role with ability. Record phase, format, valid balls and conceded runs first. If you split an innings into phases, add the original runs and balls when recombining them. Do not average phase economies when their lengths differ.
Short samples move quickly. A bowler conceding two runs from five valid balls has an economy of 2.40; a six from the next ball raises it to 8.00. Both figures are correct snapshots. Neither justifies a confident long-term ranking. Missing delivery data also means you may know economy without being able to verify dot percentage.
Check the denominator yourself
A fictional spell contains eighteen valid balls and twelve conceded runs. Ten valid deliveries produced no team runs. Calculate economy and the dot percentage using this guide's definition.
Show the answer
Economy is 12 × 6 ÷ 18 = 4.00. Dot percentage is 10 ÷ 18 × 100 = 55.56%. The answer should retain eighteen valid balls as the sample size.
When taking this method to a real scorecard, use its final corrected bowling figures and inspect the provider's delivery conventions before comparing dot-ball records.
Sources & scope
Worked examples and diagrams are illustrative, not live match records. Scene photographs are AI-generated illustrations. Rules are reviewed against the linked sources; the applicable competition’s playing conditions take priority.